

Today we’re exploring another well-loved AccountKit feature as part of our ongoing Deep Dive Series. The Client Map Tool helps you create clever visual diagrams of client business structures and entity relationships.
Why I built this tool
As a computer game designer in a former life, I like to bring strong visual appeal to client presentations. Previously, when proposing a new business structure for clients, I spent hours creating diagrams that accurately conveyed complex entity relationships. With AccountKit’s Client Map Tool the process is simple and you don’t need advanced design skills. Each diagram is customisable so that various entities can be displayed. It can be configured to any practice’s branding, appearing seamlessly amongst client presentations. Also, relying on the broader team to update the diagrams was time consuming as they would have to dig around for new structures, changes to relationships and the like across multiple platforms such as Xero Practice Manager, NowInfinity and BGL.
Client Map Tool FAQs
Does it integrate with Xero Practice Manager?
Yes. Don’t waste time setting up relationships and client information that you’ve already created in Xero Practice Manager. Any changes you make to client information will automatically sync between Xero Practice Manager and AccountKit. Your practice administrator needs to make the first connection through the integrations tab on the practice settings page. Ensure that each client has been assigned a group within each client page, as without a group, no entities will appear within the map.
Is it easy to use?
Yes. If you’re able to use a mouse to click and drag, then you can use this tool.
How do I get started building a map?
Head to the client map list page from either favourites or tools. Select Create New Client Map and identify the client group which you’re planning to build for along with a name and description for the map. Choose your map status (see below).
What kind of maps can I create?
There are three options to choose from:
- current: represents how the group presently looks
- historical: how the group looked at some point in the past
- proposed: your recommended new structure
The current diagram has a live connection with the underlying client information, so any changes made to relationships will flow back to Xero Practice Manager and any changes to client data is surfaced when you open the map next time. The other types do not flow through, unless you convert them to a current diagram.
How do I show relationships between entities?
Select and drag lines from the circles along the middle of each entity shape to show elements such as flow of distributions, cash flow or ownership. You can use the options along the top menu bar to drop shapes onto the canvas. These can indicate movement, connection or links between entities, or even a list of properties owned within the group.

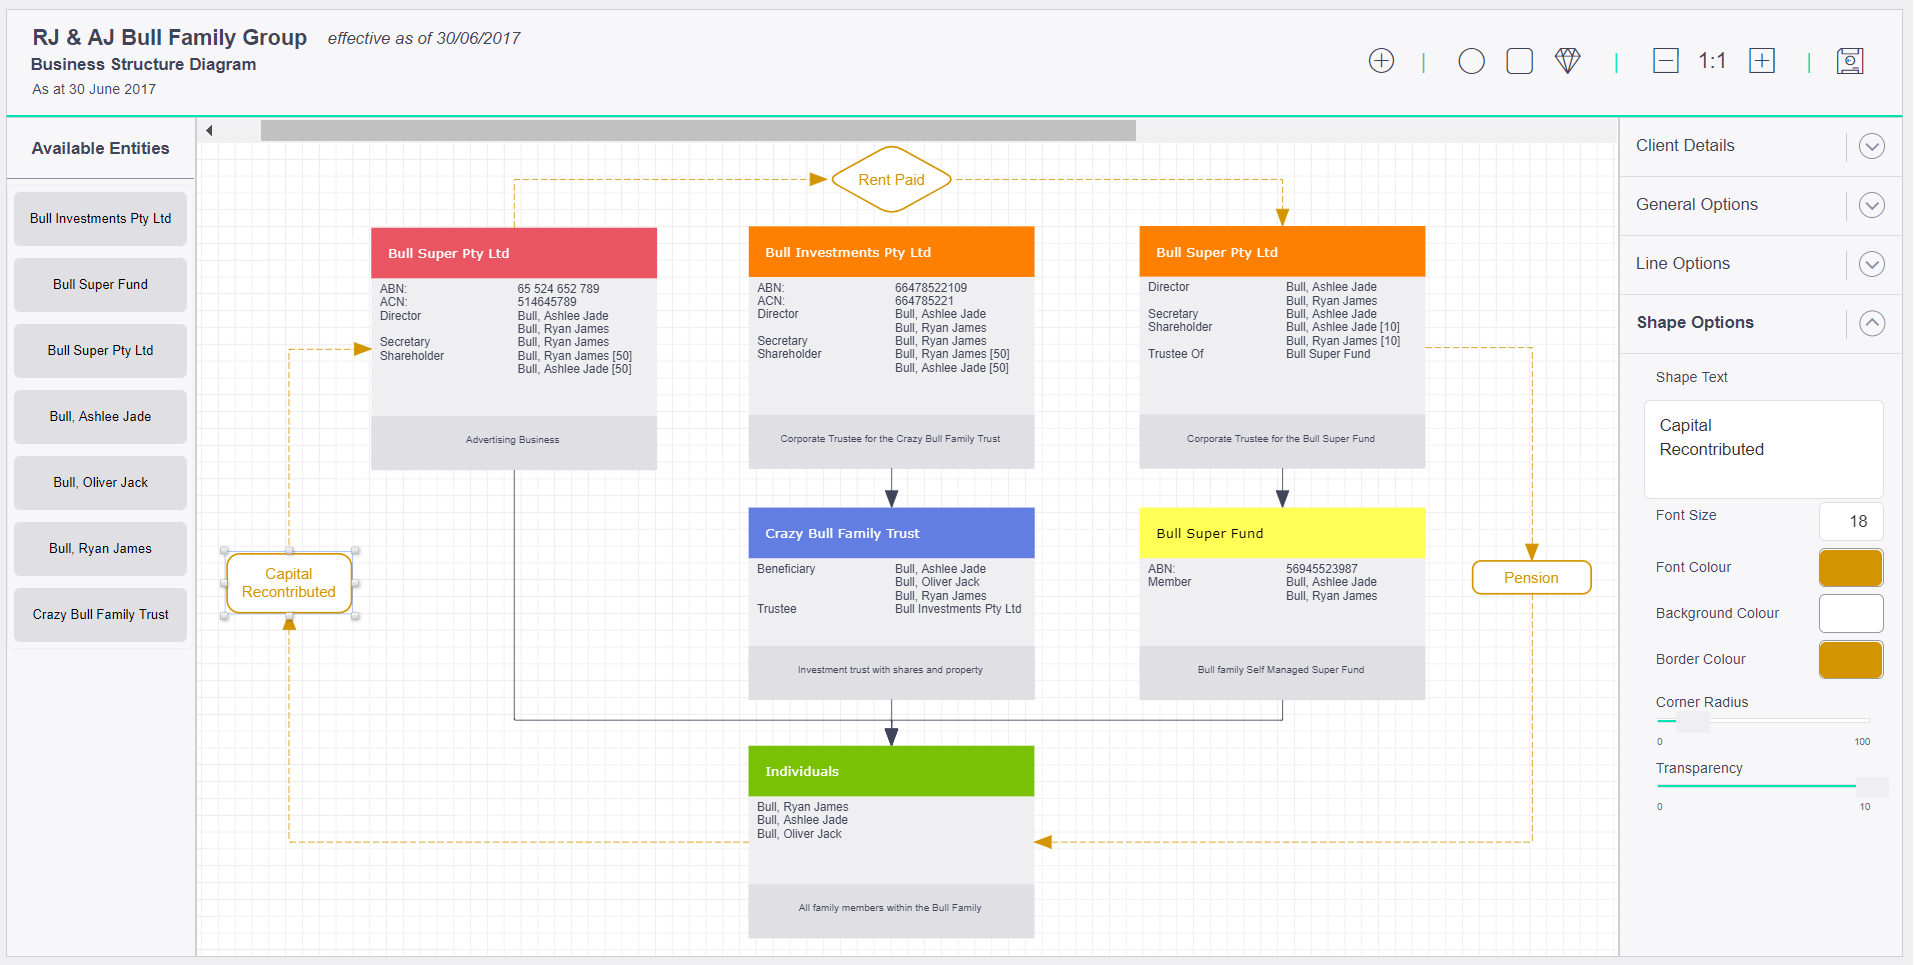
How do I customise the diagram to my practice (or client) branding?
Simply select an object and the editing options will appear in the right menu. Numerous options for shapes, lines and colours are available to you. Make sure also to update your practice colours and logo within the practice settings so that the end result is consistent with your practice’s branding.
How do I get the best out of this feature?
- Start playing with it and using it regularly and you’ll find it very easy to use. Here’s some pro tips to help you even more:
- hold the shift key and scroll your mouse wheel to zoom in and out of the canvas—great for dealing with lots of entities
- by default, the available entity types will mirror what’s in Xero Practice Manager setup. You can customise the global look of each entity type from within Practice Settings/Lists and Tags
- changing basic client details (eg. an entity description) or relationships will flow back to the underlying client information within AccountKit and Xero Practice Manager
- from the client map list page, the middle option is an output to a PNG file with no branding or titles—you can now use the client map image to add visuals to a powerpoint presentation or other printed media
User feedback
“The group chart feature is terrific. Many of our clients have multiple entities, and the group chart feature gives a pictorial illustration, creating ‘at a glance’ snapshots that clients love. No client wants 30 pages of reports. Creating this manually would take hours—this takes minutes. It is especially useful for reporting to CEOs and senior board members without the financial background.”
Cameron Brown, Partner, Lawrence Group
“AccountKit has so many features we are still exploring. We are just starting to make full use of elements such as client entity maps, which look so good. I would not hesitate to recommend AccountKit to any accounting firm.”
Jonathan Kane, Director, RBK Advisory
Want to check out the Client Map Tool? Sign up for a free trial of AccountKit to see how it works first hand. Or, to find out more, join a Webinar, for a live demonstration of the key features so you can see for yourself how easy it is to use.
Share this

Client authority grouping for standardised BAS lodgement checklists and deadlines

Your Practice Control Room: Everything Connected Within One App
.png?width=1200&height=628&name=AK_Blog%20Images%20(3).png)